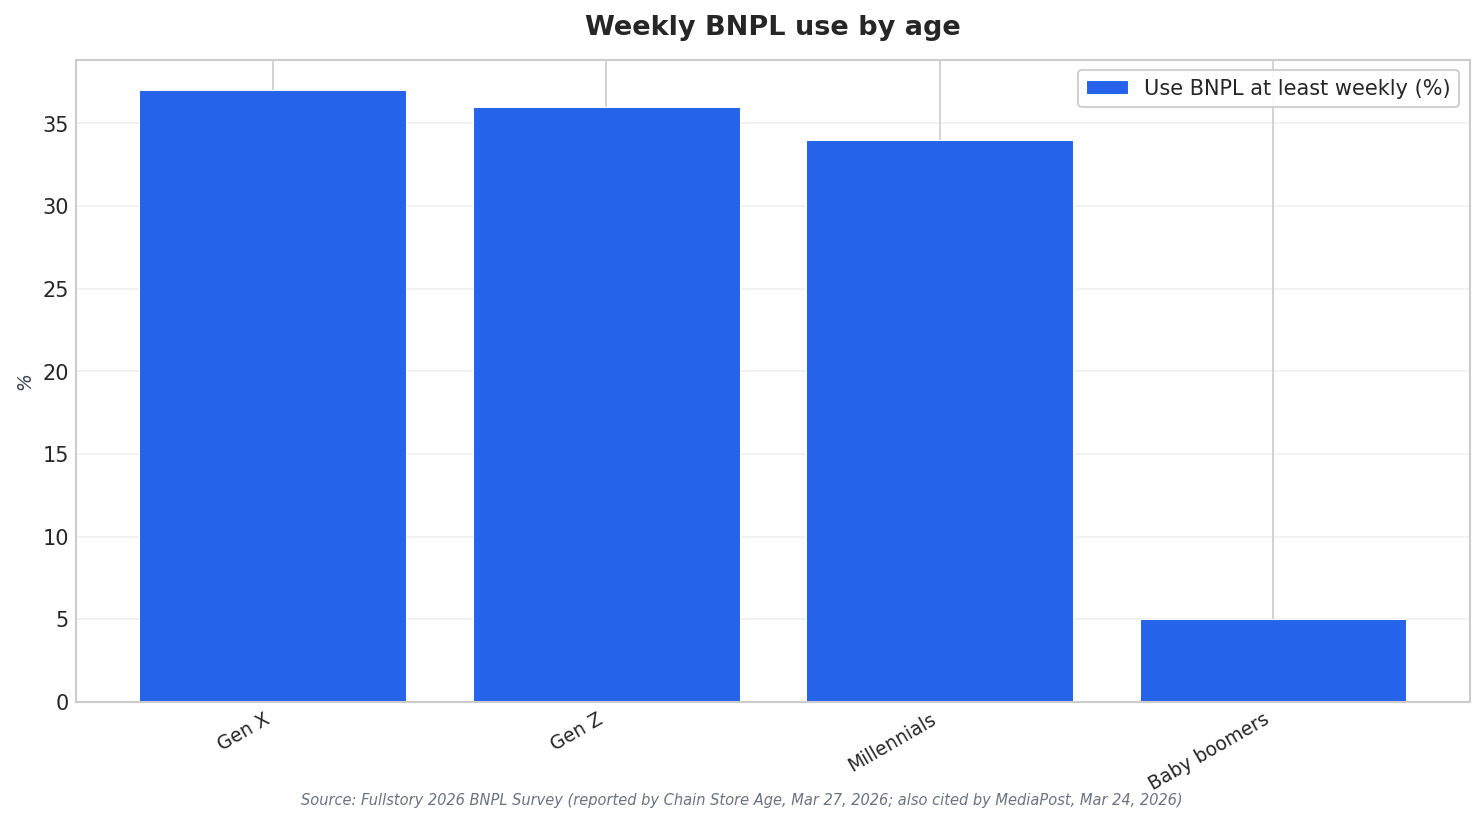
Buy now, pay later is no longer a niche checkout option. In a February 2026 survey from Fullstory with more than 1,000 consumers, 48% said they use BNPL services at least weekly. Usage is not confined to one age group, but it is uneven across generations. The same survey shows weekly BNPL usage at 37% for Gen X, 36% for Gen Z, and 34% for millennials, while baby boomers sit at 5%. These patterns help frame the conversation about momentum in Southeast Asia, including the Vietnam buy now pay later market, where adoption narratives often hinge on frequency, convenience, and mobile habits.
Frequency alone does not tell the full story. Fullstory’s research also shows how deeply BNPL can shape everyday purchasing. Nearly one-third of respondents (30%) said they use BNPL for more than half of their purchases. Another 27% said they use it for more than one quarter of their purchases. Affluence also appears in the usage mix. Among those with a household income of $150,000 to $174,999, 54% use BNPL multiple times a week. But only 4% of those in the $25,000 to $49,999 range do the same. For merchants, this points to segmentation: BNPL can be both a budgeting tool and a premium conversion lever, depending on the customer base.
What People Buy With BNPL and Where They Use It
Product category matters because it reveals where BNPL fits best in the basket. In the Fullstory survey, more than a third (37%) chose electronics as the top purchase type for BNPL. Clothing and accessories followed at 26%, then home goods and furniture at 12%. Electronics also leads by generation, including 40% of millennials, 38% of Gen Z, 36% of Gen X, and 28% of baby boomers. Channel behavior is also clear. When asked where they use BNPL most often, 51% said mobile apps, versus 29% in-store and 20% via web browsers. That mobile preference is consistent across generations, including 52% of millennials and 52% of Gen X.
But rapid adoption does not guarantee smooth checkout. Fullstory reports that 81% rate BNPL as convenient or very much so, yet 79% abandon BNPL checkouts at least sometimes, and 32% abandon almost always. The reasons are specific. Fear about hidden fees or unclear interest was cited by 34%. An unclear payment schedule followed at 30%. Having to re-enter information was cited by 13%. These pain points matter for any market narrative, including Vietnam, because they highlight where growth can stall. BNPL can boost conversion only when costs and payment schedules are transparent and the flow is frictionless.
Finally, satisfaction data suggests a trust gap between provider types. JD Power’s 2026 U.S. Buy Now Pay Later Satisfaction Study, fielded from January 2025 to January 2026 with 3,909 customers, found bank-based BNPL services scored 704 on a 1,000-point scale, up 59 points year over year. FinTech BNPL brands scored 603, down 17 points. In that same JD Power study, more than a third (37%) of U.S. consumers used BNPL in the past 90 days, up five percentage points in a year, and 50% of consumers under 40 did so. For BNPL expansion stories, the signal is simple: usage can rise fast, but user experience and trust can decide who wins repeat behavior.
How often are consumers using BNPL in recent survey data?
What are the most common items bought with BNPL?
Where do people use BNPL most often: mobile, in-store, or web?
Why do shoppers abandon BNPL checkout flows?
What signals should brands watch in the Vietnam buy now pay later market as adoption rises?